


Reproduced with permission from AppzBizz blog.
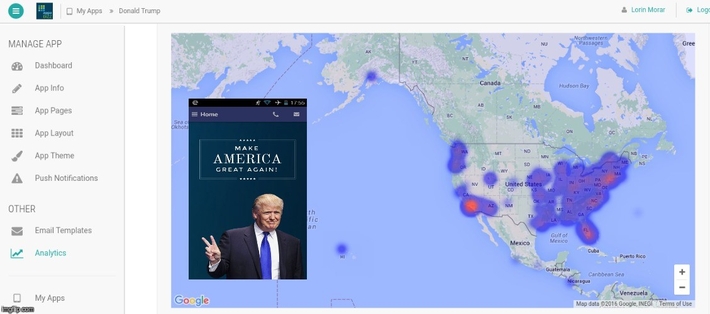
Heatmaps: have you heard of them? It is a safe bet that you saw some even if the term "heatmap" doesn’t tell you much. Above you can see an example of such a heatmap in AppzBizz analytics: this one shows the density of the Donald J. Trump app installs according to the geolocation of the smartphone or tablet in US.
Heatmaps are essentially a two-dimensional representation of data in which values are represented by colors.The term "heatmap" was originally coined and trademarked by software designer and entrepreneur Cormac Kinney in 1991, to describe a 2D display depicting real time financial market information. Heatmaps became later quite popular and started to be applied in different domains because they are visually compelling and (if well executed) convey the gist of the data at a single glance.
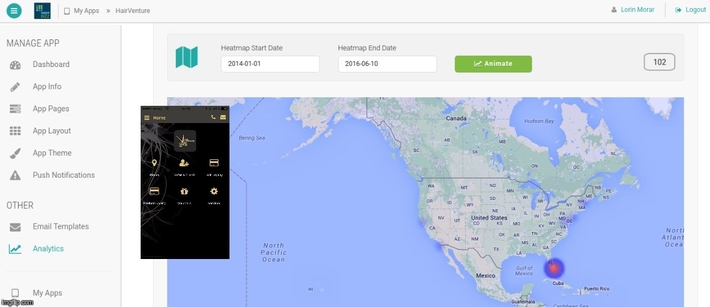
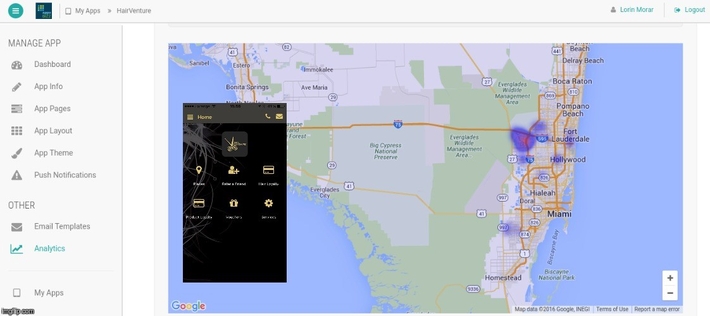
Within this broad definition you will find very different types of heatmaps. As part of our analytics toolbox, AppzBizz offers a density function visualization superimposed on Google Maps for any app created on our platform. This allows app owners the opportunity to visualize where were the smartphones located at the moment of the install with considerable accuracy. With a press of a button, the owner of the app can also see an animation showing how is the app "spreading" around.
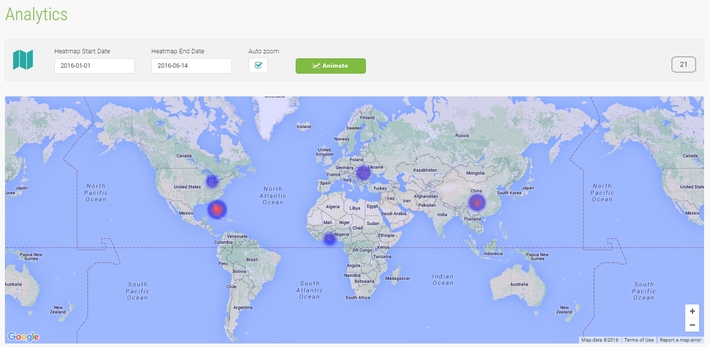
One interesting fringe benefit we have discovered after the fact is that heatmaps makes cybersecurity monitoring much more intuitive and visual. The heatmap generated for Palm Island App you see above shows you instantly that there is a lot of unexpected activity in China and some in Ghana. Since Palm Island app is essentially useless to anyone except the residents of that particular gated community, this is equivalent to a cybersecurity red flag. Indeed, after checking our server logs, it became apparent we had an "admirer" in Chengdu who tried repeatedly to gain access to the app, but never got past the security measures.
All in all, a great tool that will help you think in terms of precision marketing with some added cybersecurity fringe benefits!
Posting comment as guest.
If you already have an account, please LOGIN.
If not, you may consider creating on. It’s FREE!